
Progressing our decarbonisation journey
Limit Emissions
At MAS, limiting emissions is embedded in how we operate, innovate, and scale our business responsibly. It reflects our commitment to align growth with climate action by reducing environmental impact while strengthening long-term resilience.
Our approach is guided by science-based targets and a clear focus on decarbonisation across operations and the value chain. We prioritise efficiency, transition toward lower-impact energy sources, and strengthen accountability across our ecosystem.
This includes scaling renewable energy through initiatives such as Project Photon, expanding the use of certified biomass, and advancing certified biomass conversion across Sri Lankan operations as a key pathway to reduce reliance on fossil fuels. In parallel, we are engaging our supply chain to drive broader adoption of science-based targets and enable emissions reduction beyond our direct operations. Additionally, we are strengthening our renewable energy strategy through power purchase agreements in India, a Renewable Energy Certificate (REC) agreements in Indonesia, and the purchase of iRECs across our facilities in Sri Lanka, Vietnam and India..
Key Priorities Shaping How We Limit Our Emissions
Our approach focuses on managing emissions across all categories, and prioritising key levers that drive continuous improvement across operations and the value chain.
Monitoring and reducing emissions from our operations through improved efficiency and lower-impact energy use
Strengthening measurement and engagement to reduce and manage emissions across the value chain
Monitoring and managing air pollutants and ozone-depleting substances in line with regulatory requirements
Increasing the use of renewable and lower-impact energy while improving efficiency through monitoring and optimisation
0.0%
reduction of Scope 1 and 2 emissions
0%
of suppliers by spend with SBTis
0%
of joint ventures in Scope 3 investments with SBTis
Group GHG Emissions
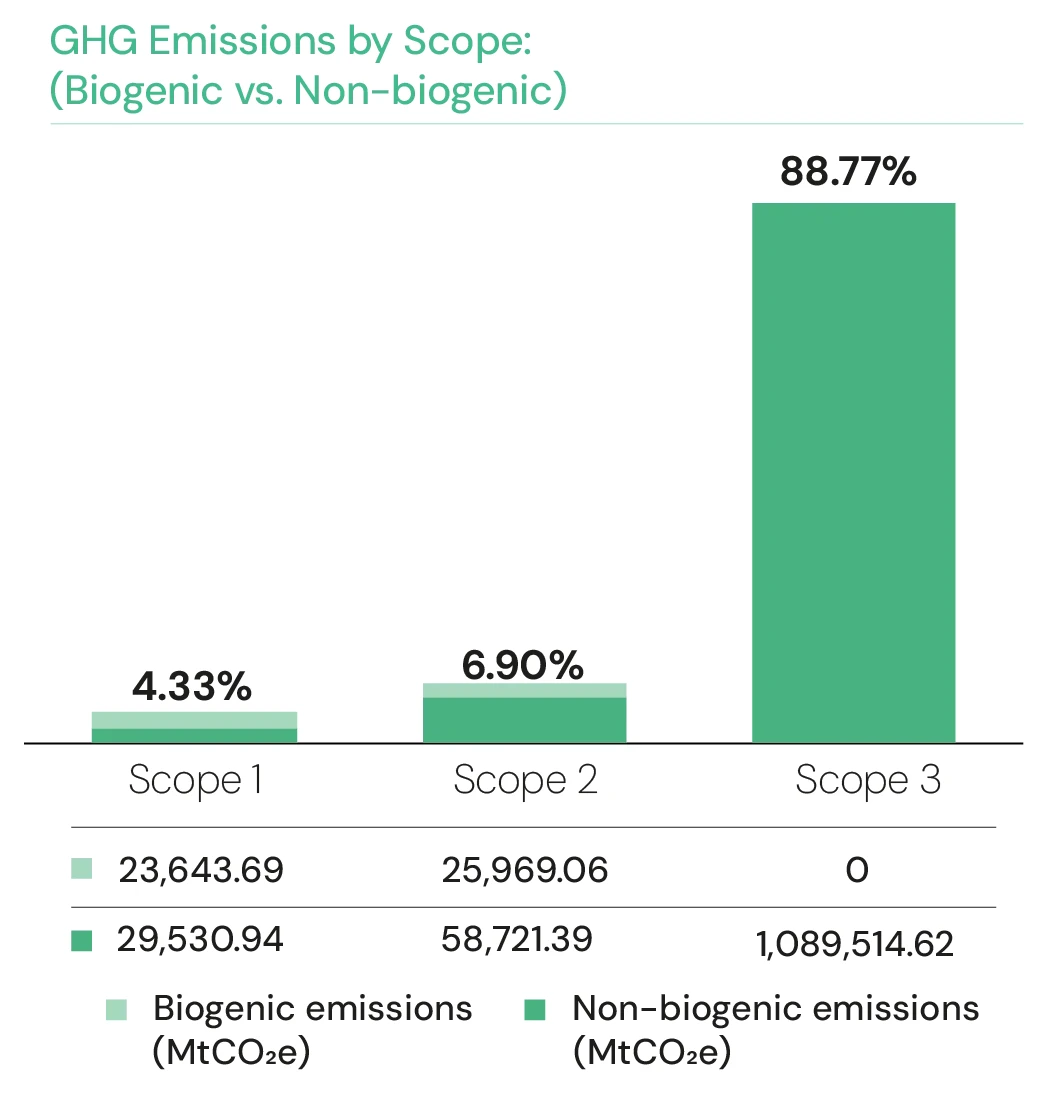
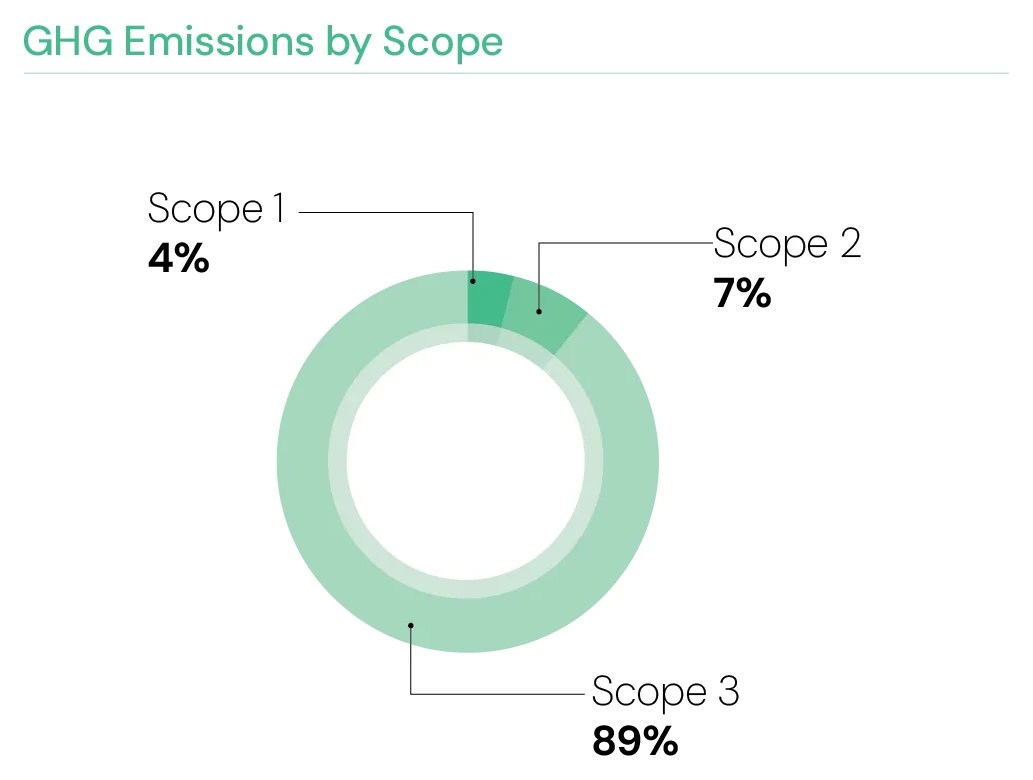
Total Group GHG emissions in 2025 amounted to 1,227,379.71 MtCO₂e. Scope 3 remained the dominant contributor, accounting for 88.77% of the Group's total emissions footprint, largely driven by purchased goods and services and downstream transportation and distribution.
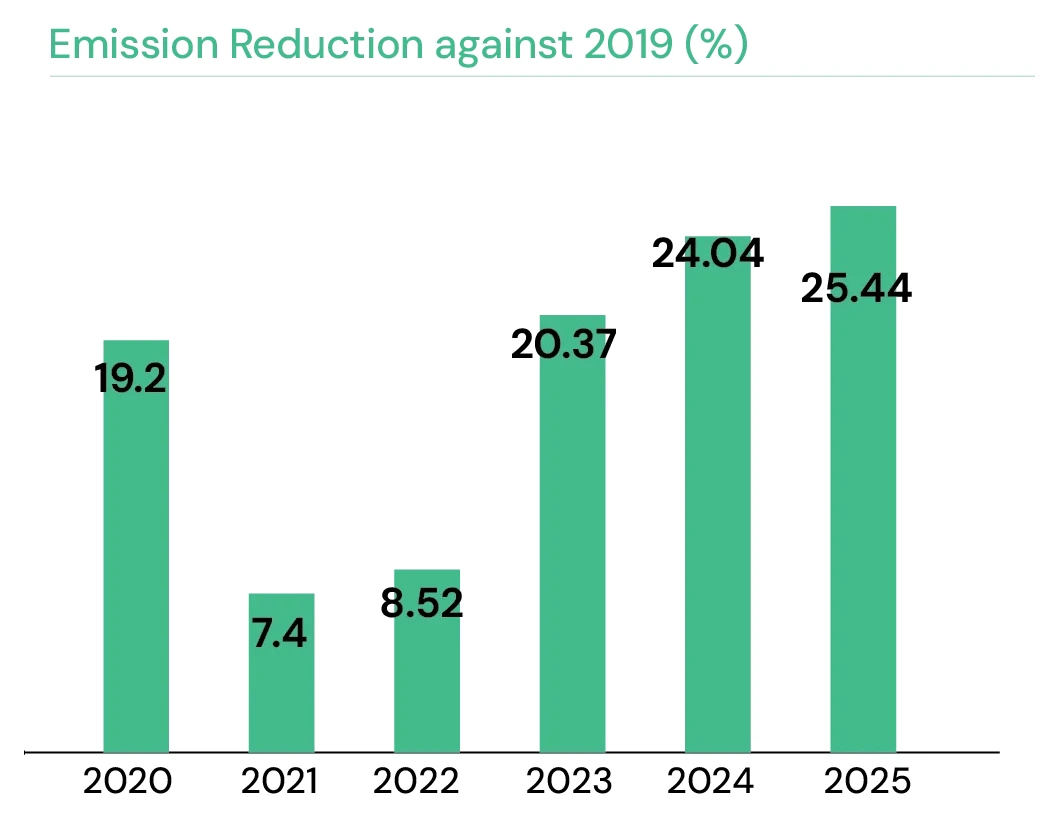
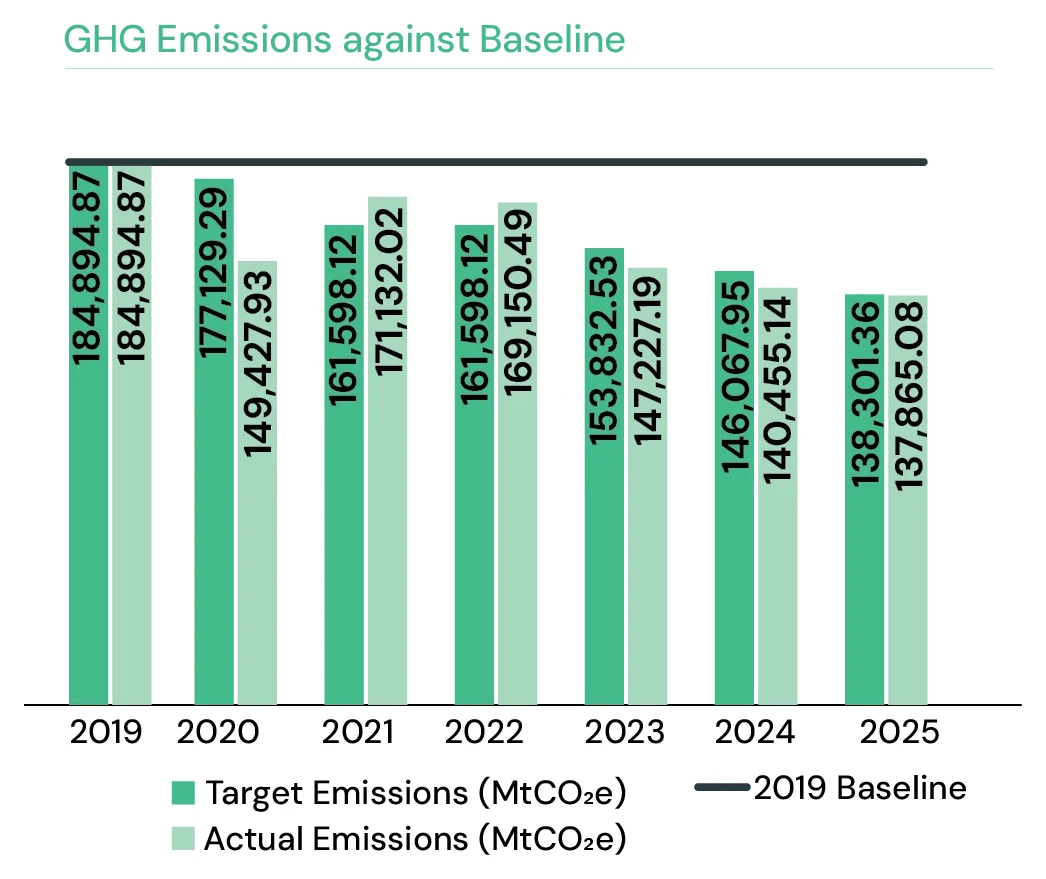
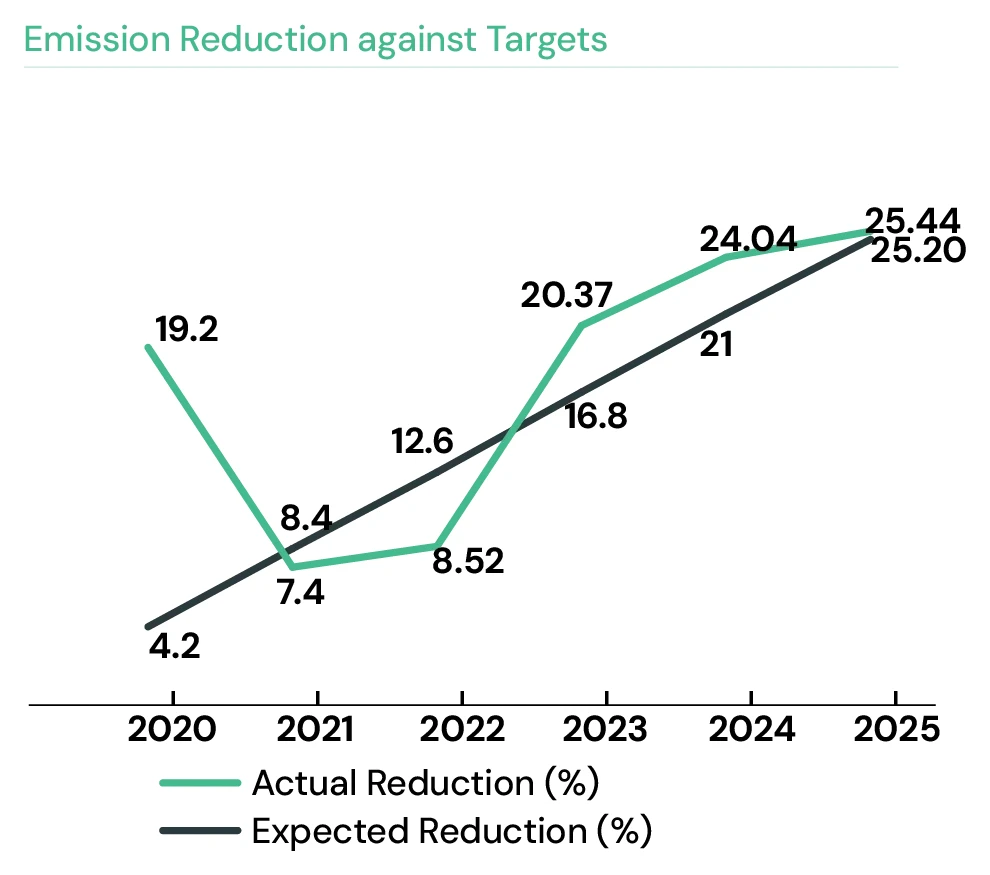
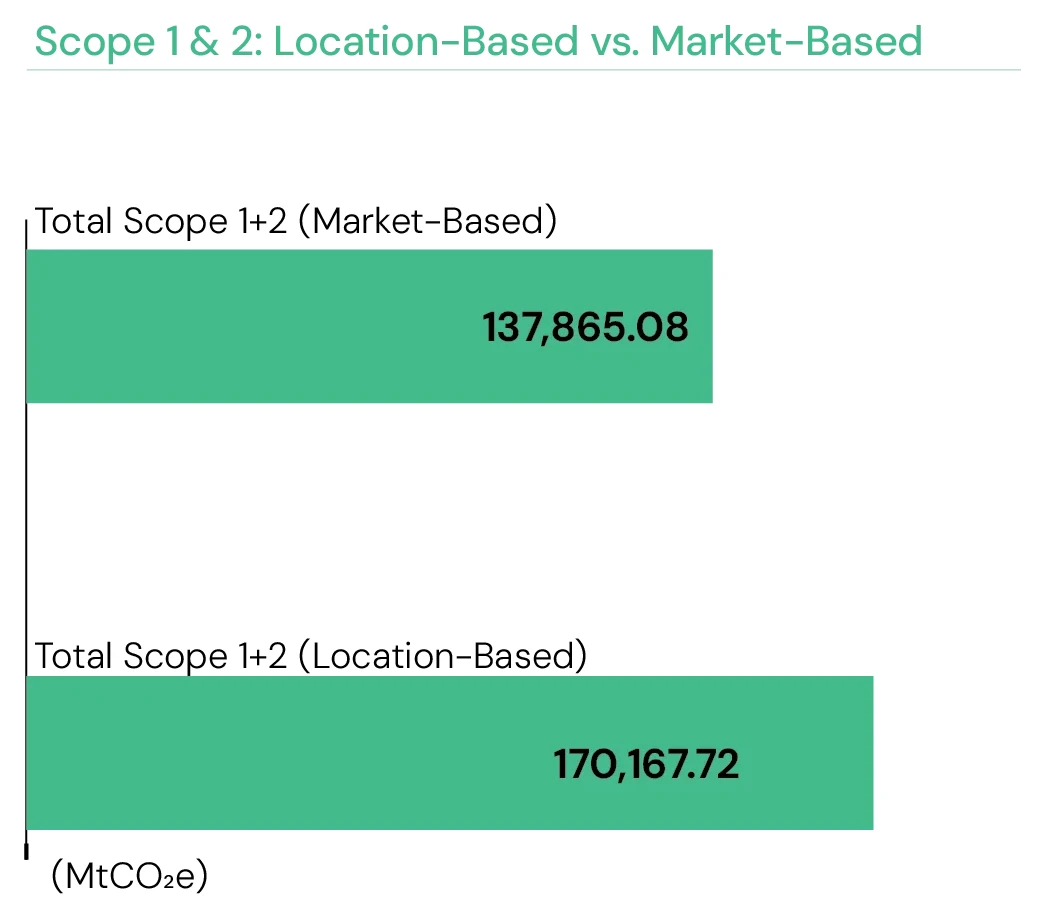
Scope 1 and Scope 2 actual emissions totalled 137,865.09 MtCO₂e, compared with target emissions of 138,301.36 MtCO₂e. In 2025, we achieved a 1.84% reduction in Scope 1 and 2 emissions against the previous year, exceeding our near-term science-based target of 25.2% against the 2019 baseline. This progress reflects improvements in how energy is sourced and used across operations, alongside continued efforts to work with partners across the value chain. We track emissions and energy performance across key areas of our operations and value chain to monitor progress, strengthen accountability, and identify opportunities for further improvement.
- GHG Protocol and IPCC AR6
- International Energy Authority (IEA) factors
- HIGG FEM and PM
- U.S. Environmental Protection Agency (EPA)
- India Specific Road Transport Emission Factors – India GHG Program
0.00 MtCO₂e
Total Group GHG emissions
0.00 MtCO₂e
Target emissions
0.00 MtCO₂e
Scope 1 and 2 actual emissions
0.0%
Expected reduction from baseline
0.00%
Actual reduction from baseline
Emissions at a Glance
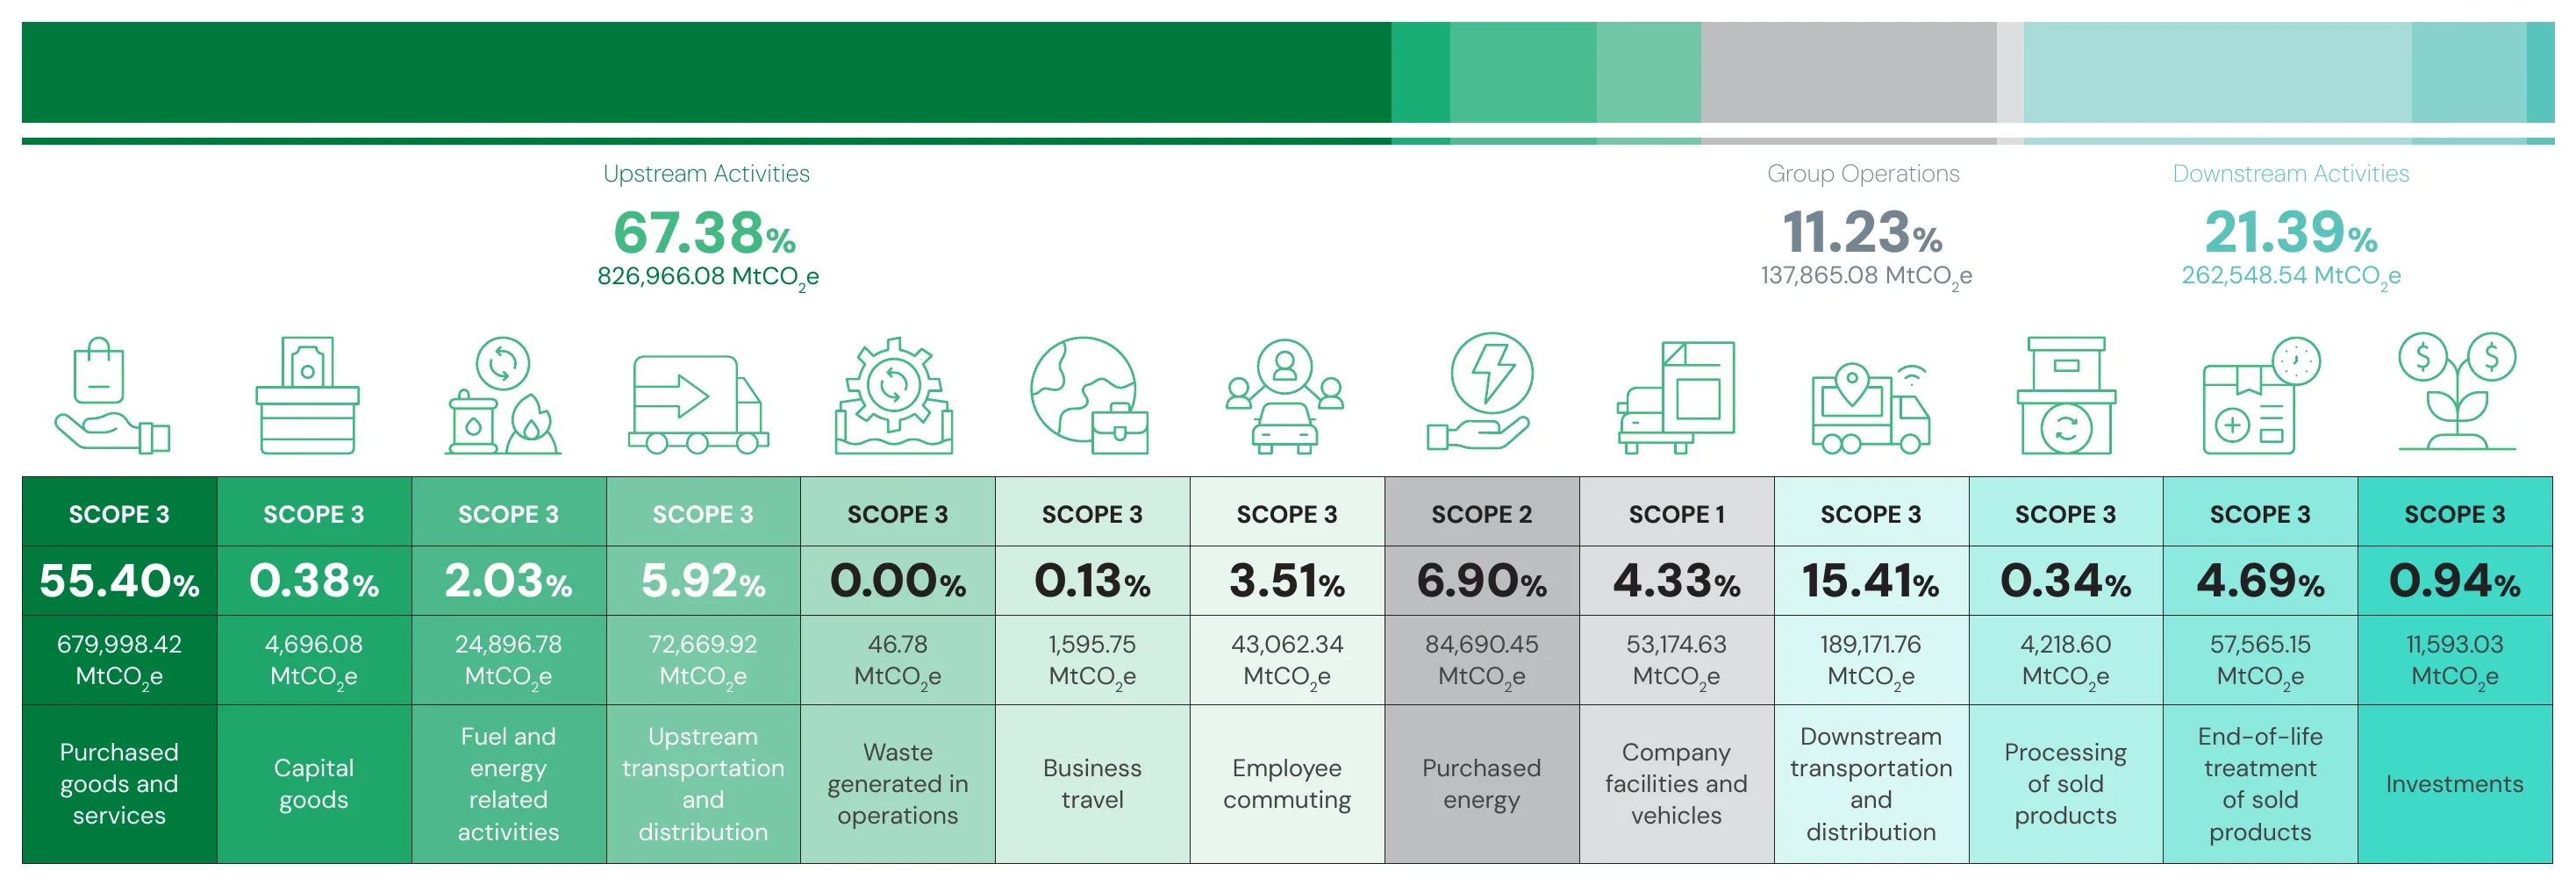
Our carbon footprint spans a range of activities across the value chain, including raw material sourcing, Group operations, transportation and distribution, product processing, and end-of-life treatment.
Scope 1 and 2 – Direct and Indirect Emissions of our Operations
The reduction in Scope 1 and Scope 2 emissions was supported by a combination of cleaner energy use and improved operational efficiency, as outlined in the previous pages.
Efforts to reduce Scope 1 emissions focused on improving performance in energy-intensive processes such as dyeing and finishing, while continuing to reduce the use of fossil fuels.
Scope 2 emissions were reduced through:
- Expansion of renewable energy sources such as solar and biomass
- Use of Renewable Energy Certificates (RECs)
- Power Purchase Agreements (PPAs) in key locations and through purchase of IRECs (offsetting through IRECs)
Biogenic and Non-biogenic Emissions
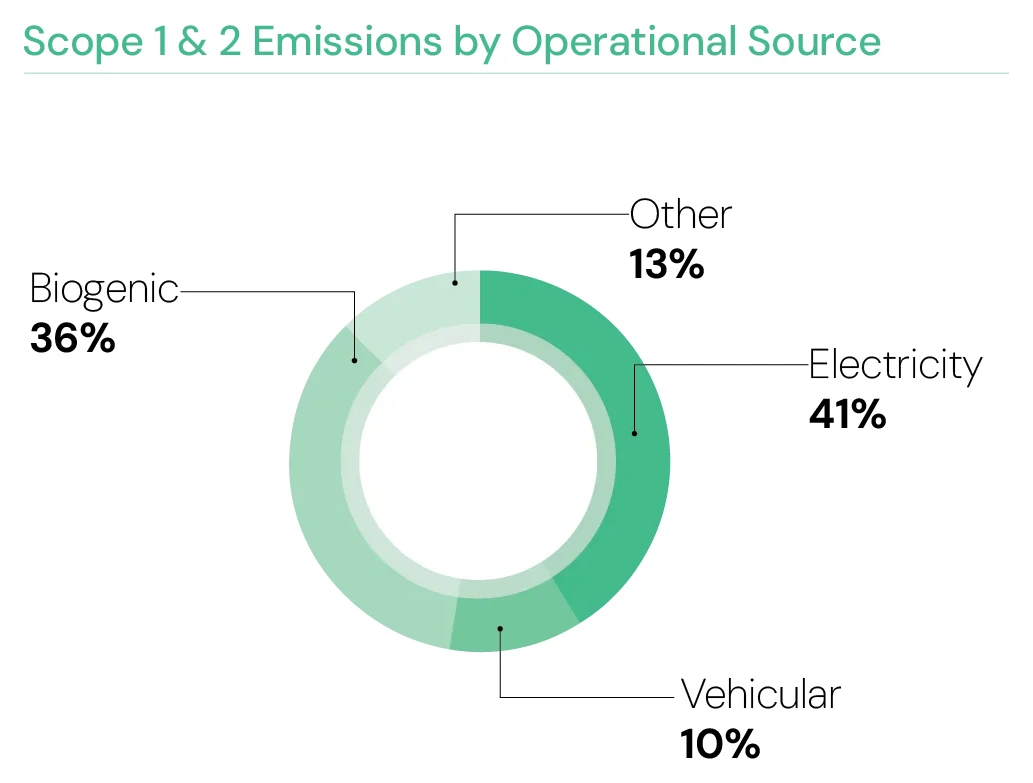
MAS' operational emissions profile is comprised of both biogenic and non-biogenic sources across Scope 1 and Scope 2 emissions. Biogenic emissions accounted for a higher share of Scope 1 emissions, while Scope 2 was largely driven by non-biogenic emissions. Overall, non-biogenic sources represented the larger share of operational emissions, reflecting the continued influence of purchased electricity and fossil fuel-based energy use within the energy mix.
Scope 3 – Emissions Across our Value Chain
Scope 3 emissions remain the largest component of our total emissions footprint, primarily driven by purchased goods and services. The apparel value chain involves a wide network of suppliers and partners, with emissions extending beyond direct operations. Given its scale and complexity, reducing these emissions requires stronger supplier engagement, improved data, and material innovation.

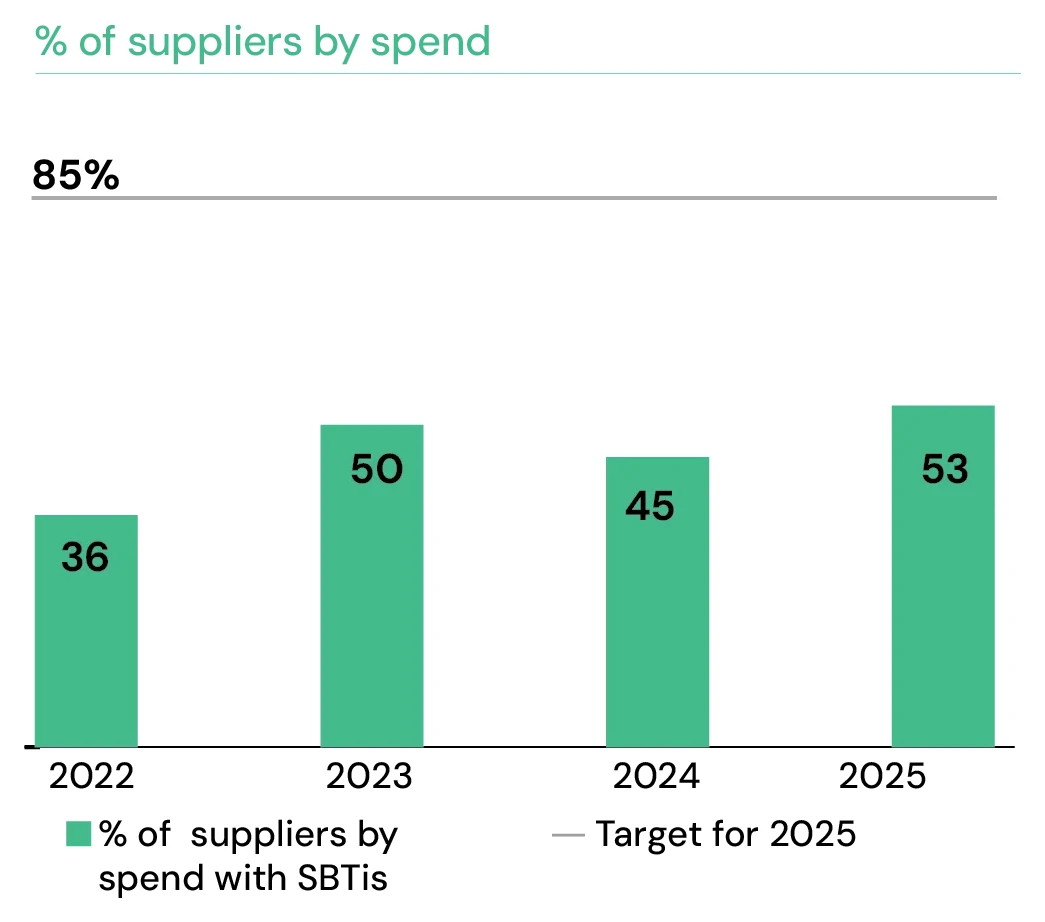
53%
of suppliers by spend committed to SBTi (2024: 50%)
100%
alignment maintained with SBTi commitment across joint ventures, including Prym, TRISCHEL, and Stretchline
Although supplier alignment improved during 2025, it remained below our aspirational SBTi supplier engagement commitment of 85% of total spend, reinforcing the need to accelerate broader engagement with supply chain partners.

- Expanded data granularity for capital goods and fuel-related activities
- Broadened coverage within Purchased Goods and Services
- Included additional upstream emissions (e.g. fuel transport and energy-related activities)
These improvements provide a more complete and reliable view of value chain emissions.

Reduction efforts within Scope 3 are closely linked to product transformation initiatives with a focus on material innovation and circularity.
- 15% recycled raw materials in primary products
- Advanced textile-to-textile recycling solutions, including Cycora®
- Initiated expansion of circular solutions beyond polyester into nylon
These efforts support a shift away from virgin materials while enabling lower impact product pathways across the value chain.
Products Changed for Good
- Strengthen supplier engagement and accountability
- Expand circular materials across polyester, nylon, and cotton
- Increase use of lower-impact and regenerative materials
Expected to improve emissions intensity and moderate long-term emissions growth.
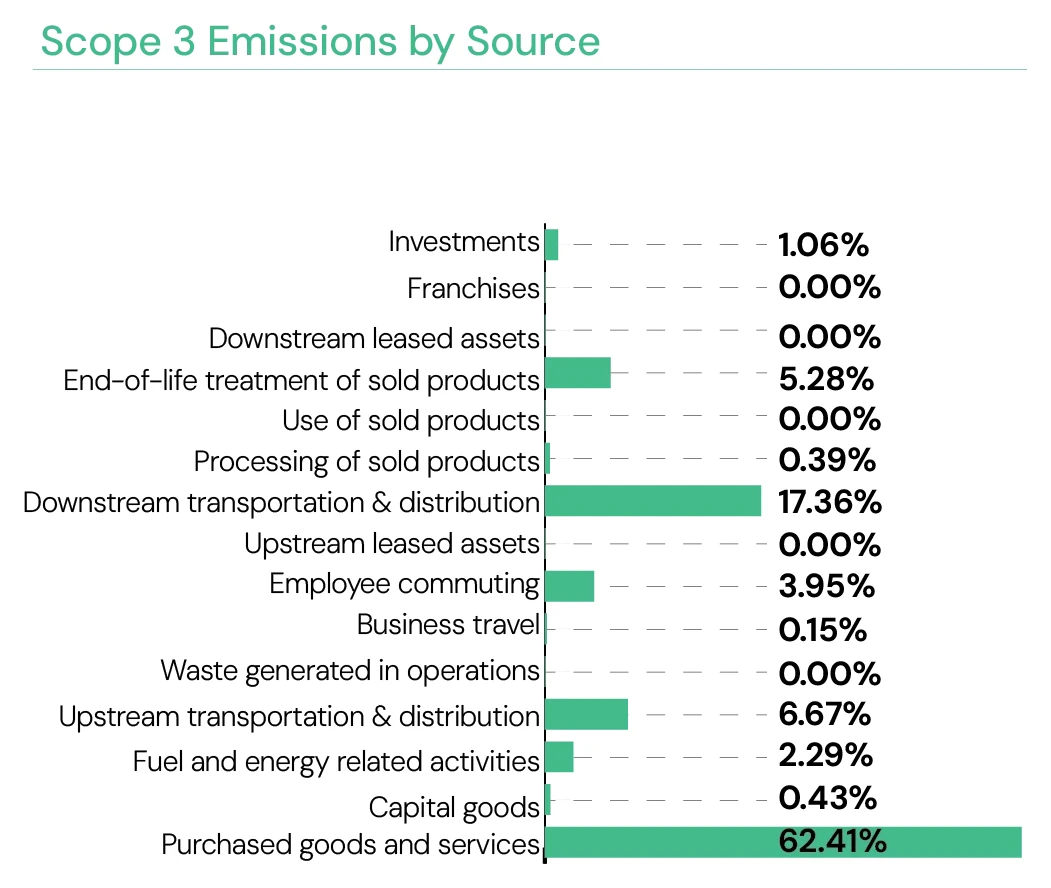
During the year, Gross Scope 3 emissions in 2025 amounted to 1,089,514.62 MtCO₂e, reflecting a 11.13% decrease from 1,225,959 MtCO₂e in 2024. This reduction was recorded despite the Group continuing to strengthen the completeness and reliability of its Scope 3 inventory through broader data coverage and improved granularity across key upstream categories.
Purchased goods and services accounted for 62.41% of Scope 3 emissions in 2025. Transportation and distribution represented a further 24.03%, comprising upstream transportation and distribution at 6.67% and downstream transportation and distribution at 17.36%. Employee commuting accounted for 3.95%, while end-of-life treatment of sold products contributed to 5.28% of total emissions.
The 2025 Scope 3 profile reinforces the continued importance of supplier engagement, improved data quality, logistics optimisation, and material innovation in addressing emissions across the wider value chain. As in the previous year, Category 11, the use of sold products, has not been considered within the Scope 3 boundary, in line with allowances under the GHG Protocol guidelines.
1,089,514.62 MtCO₂e
Gross Scope 3 emissions in 2025
11.13%
Year-on-year reduction from 2024
62.41%
Share from purchased goods and services
24.03%
Share from upstream and downstream transportation and distribution
Other Significant Emissions
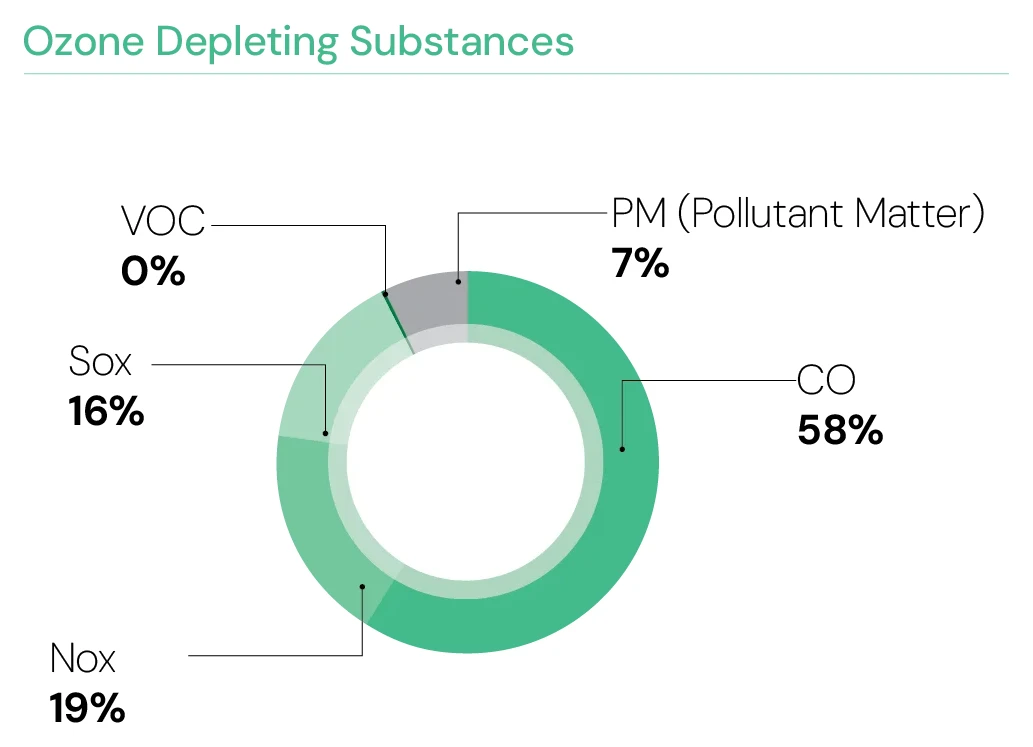
The Group's environmental management processes include the regulation and monitoring of air quality and other air emissions from our facilities, in compliance with local regulations and international best practices. While our operations do not use Ozone Depleting Substances (ODS) in primary processes, products, or services, we continue to account for the presence of hydrochlorofluorocarbons (HCFCs) in Heating, Ventilation, and Air-Conditioning (HVAC) systems. In 2025, emissions associated with ODS amounted to 2,106.54 MtCO₂e.
In addition, the Group continued to monitor other air emissions arising from operational activities, including carbon monoxide (CO), nitrogen oxides (NOx), sulphur oxides (SOx), volatile organic compounds (VOC), and particulate matter (PM). Our efforts to phase out ODS remain aligned with regulator-driven requirements in the countries we operate in, including Sri Lanka.
2,106.54 MtCO₂e
Ozone-depleting substances from HCFCs in HVAC systems
75.7%
increase in ODS year-on-year
OUR PATHWAY TO NET ZERO BY 2048
Reducing emissions across operations, materials and the value chain
Strategic Ambition
MAS has established a formal decarbonisation roadmap to reach Net Zero emissions by 2048, supported by interim science-based targets for 2030. The roadmap focuses on reducing emissions across operations, transitioning to renewable electricity, transforming materials and products, advancing circularity, and engaging suppliers across the value chain.
MAS Capital (Pvt) Ltd also commits to reduce absolute Scope 3 GHG emissions from purchased goods and services, upstream transportation and distribution, business travel, employee commuting, downstream transportation and distribution, processing of sold products and investments to 46.2% within the same timeframe.
When setting new SBTi targets, we have considered that the target boundary includes land-related emissions and removals from biogenic feedstocks, aligned to SBTi Criteria and Recommendations for Near-Term Targets Version 5.1. Hence, our baseline emissions changed from 184,894.87 to 134,272.14 MtCO₂e. From 2026 onwards, we will be reporting using the new baseline aligned with SBTi 5.2 criteria.
2019
- Baseline year for emissions reduction
2030
- 80% absolute reduction in Scope 1 and 2 emissions
- 46.2% reduction in Scope 3 emissions
2048
- 90% absolute reduction across Scopes 1, 2 and 3
- 100% renewable electricity ambition
Reducing energy intensity across manufacturing operations through infrastructure upgrades, process optimisation and improved cooling efficiency.
Key levers
- Centralised air conditioning
- Variable Speed Drives for motors
- Digital timer controls for lighting
- High-efficiency heat seal machines
- Compressor grid optimisation HVAC efficiency for heat stress management
Transitioning electricity consumption towards renewable sources, with the ambition of covering 100% of electricity demand through renewable sources by 2048.
Key levers
- Rooftop solar across manufacturing facilities
- Off-site Power Purchase Agreements
- Open energy access schemes in Sri Lanka
- Virtual and direct PPAs in India, Indonesia, Vietnam and Jordan
- i-RECs and TIGRs where direct renewable access is limited
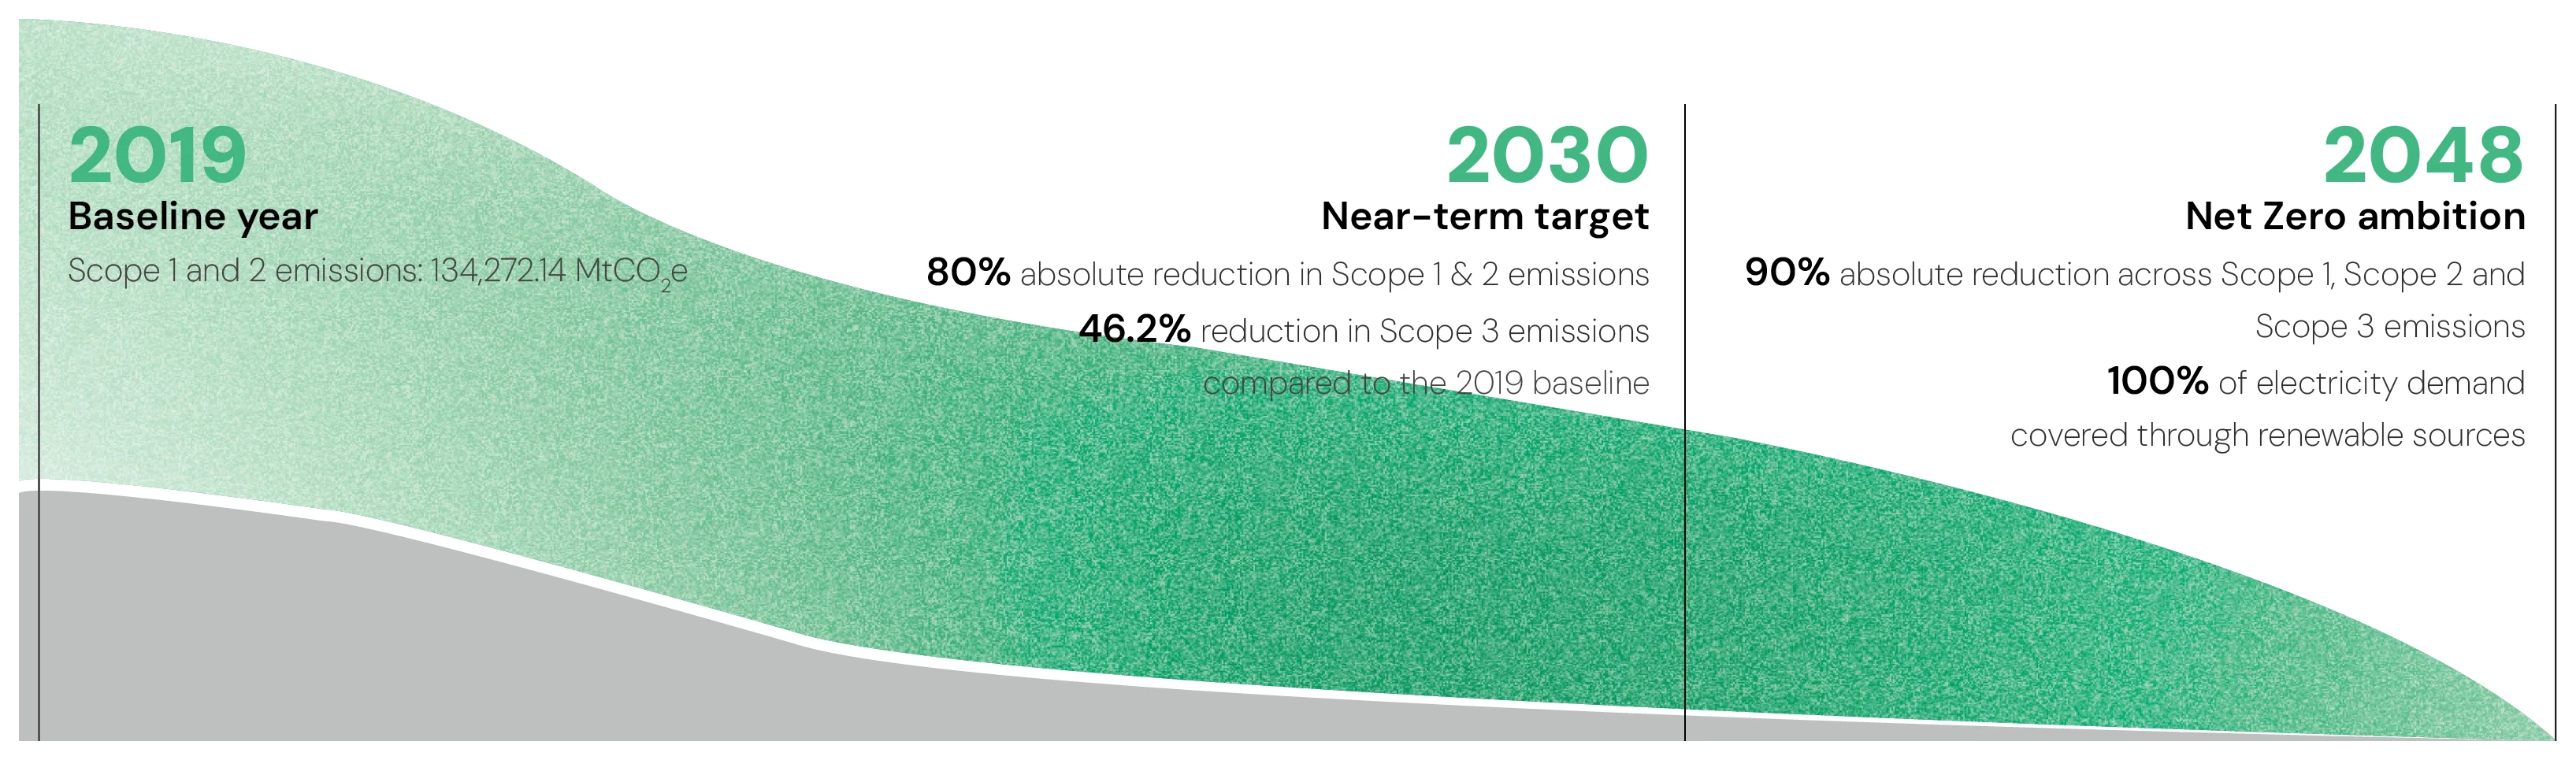
2019
Baseline year
- Scope 1 and 2 emissions: 134,272.14 MtCO₂e
2030
Near-term target
- 80% absolute reduction in Scope 1 & 2 emissions
- 46.2% reduction in Scope 3 emissions compared to the 2019 baseline
2048
Net Zero ambition
- 90% absolute reduction across Scope 1, Scope 2 and Scope 3 emissions
- 100% of electricity demand covered through renewable sources

Reducing value chain emissions by shifting towards lower-impact materials and increasing the share of sustainable products in the portfolio.
Key levers
- 75% revenue from sustainable products
- – Recycled polyester and nylon
- – Regenerative or organic cotton
- – Man-Made Cellulosic Fibres and other natural material alternatives
- Moving toward 100% certified biomass for steam generation by supporting smallholders
- Low-carbon product innovation through R&D

Using circular design, recycling infrastructure and waste value enhancement to reduce dependence on virgin inputs, divert waste from landfill, and mitigate regulatory risks like the EU Border Carbon Adjustment Tax.
Key levers
- Textile-to-textile recycling
- Closed-loop product solutions
- 80% manufacturing waste value enhancement target
- Reuse and upcycling pathways
- Pioneering 'Engineered Knit' to produce zero-waste garments
- Design for longevity and recyclability

Extending emissions reduction beyond MAS' own operations by working with suppliers and logistics partners to reduce value chain emissions.
Key levers
- Supplier engagement across Tier 1 and Tier 2
- Cascading science-based targets across the supply chain
- Reducing air travel and logistics related emissions
- Transitioning to electric vehicles for manager fuel needs
- Progressing towards near-zero logistics emissions by 2048

Oversight and execution discipline
Embedding decarbonisation into leadership oversight, performance management and innovation priorities to support delivery against long-term emissions reduction targets.
Key levers
- Sustainability Advisory Council oversight
- Quarterly monitoring of decarbonisation KPIs
- Leadership incentives linked to SBTi emissions reduction targets
- Board-level visibility of decarbonisation progress
- Strategic R&D through MAS Innovation
- Dedicated budgets for low-carbon product innovation
Climate-Related Risk Identification
MAS has established a comprehensive process to identify, assess and manage climate-related risks across its direct operations and wider value chain. These risks are classified into physical risks and transition risks, enabling MAS to understand exposure across operations, sourcing networks, infrastructure, compliance requirements and long-term decarbonisation commitments.
Acute events and chronic climatic shifts that may affect operations, infrastructure, raw material availability and supply chain continuity.
Flooding
Heat Stress
Drought and Water Scarcity
Risks arising from the global shift towards a low-carbon economy, including changes in policy, technology and market expectations.
Regulatory and Policy Shifts
Renewable Energy Access
Impact on operations
Operations in Sri Lanka, including locations such as Bodyline Horana, Linea Aqua Hanwella, and Biyagama EPZ are increasingly impacted by floods. This may result in production capacity loss and operational disruption.
Impact on value chain
Primarily affects direct operations, with possible knock-on effects on continuity of production and fulfilment.
Estimated financial impact
Potential financial impact estimated at up to USD 1.1 million.
Impact on operations
Facilities in the Jaffna Peninsula of Sri Lanka face potential water scarcity, which may increase short-term operational costs.
Impact on value chain
Tier 2 manufacturing operations, particularly weaving and dyeing in China, India, Indonesia and Taiwan, require high volumes of water. Low water availability may disrupt the delivery of raw materials and affect strategic pricing arrangements.
Impact on operations
Rising temperatures in tropical manufacturing zones including Bangladesh, India, Indonesia, Jordan and Sri Lanka increase demand for HVAC and cooling systems, leading to higher indirect operating costs.
Impact on value chain
Primarily affects manufacturing efficiency and cost of operations across production locations in tropical regions.
Impact on operations
Evolving climate-related regulations are expected to increase compliance requirements and data management needs across MAS' operations and reporting processes.
Impact on value chain / markets
Several European legislative developments, including the EU Border Carbon Adjustment Tax, Digital Product Passport and EU PEF, may increase the need for product-level emissions data, traceability and compliance readiness across the value chain.
Estimated financial impact
Increased compliance and data management costs are anticipated.
Impact on operations
In developing countries such as Sri Lanka, India and Bangladesh, limited opportunities for Green Power Purchase Agreements or off-site renewable energy access may make it more difficult for MAS to decarbonise its electricity consumption in line with long-term targets.
Impact on value chain / commitments
Limited renewable energy pathways may affect MAS' ability to achieve long-term Science Based Targets. Failure to meet these commitments may create a brand reputation risk.
Climate-related Financial Exposure
MAS has quantified the proportion of selected financial metrics considered vulnerable to climate-related transition risks, supporting more informed planning around cost exposure, capital allocation and decarbonisation investment.
OPEX Vulnerability
31%–40%
of total operating expenditure is considered vulnerable to transition risks
Largely represents the additional costs of raw materials required to align with SBTi pathways and support the shift towards lower-carbon products and materials.
CAPEX Alignment
11%–20%
of capital expenditure is aligned with transition risks
Primarily relates to upgrading manufacturing equipment, including dyeing machines, over the next five years to support emissions reduction targets.
Primary Impact Areas:
Climate-related transition risks are expected to influence both operating costs and future investment priorities, particularly in relation to raw material sourcing, manufacturing upgrades and emissions reduction pathways.
Governance and Accountability
The Sustainability Advisory Council (SAC), which includes the CEO and other Board members, meets biannually to monitor progress against sustainability KPIs and manage climate risks.
MAS has identified targeted responses to manage climate-related risks across its operations and value chain:

Business Continuity
Relying on overtime planning and subcontractor hiring to mitigate flood disruptions.

Policy Engagement
MAS actively engages with regulators to enable power wheeling for off-site renewable energy projects. Leadership
Leadership Accountability and Incentive Alignment
Bonus payments for the CEO, CSO and Divisional CEOs are explicitly linked to the achievement of absolute emissions reduction targets in line with net-zero commitments.
Connecting Risk, Strategy and Action

Addressed through MAS' Scope 3 pathway, including recycled polyester and nylon, textile-to-textile recycling and lower-impact material innovation.
Refer pages 150–151
Addressed through SAC oversight, sustainability KPI monitoring, leadership incentives and the integration of climate considerations into business management.
Refer pages 46–47

Supported through on-site biodiversity management using native species, the commitment to restore 100 times the land footprint and the use of certified biomass to reduce deforestation risks.
Refer pages 175–185

Addressed through ongoing assessment of flooding, drought, water scarcity and heat stress, together with business continuity planning and infrastructure responses.
Refer pages 152–153
Energy Transition
Accelerating the Shift to Cleaner Energy
At MAS, energy transition is a fundamental component of our climate strategy, focused on transforming how energy is sourced and used across operations. We seek to achieve this by reducing reliance on fossil-based energy while building a more resilient and sustainable energy mix.
In addition to increasing the share of renewable and lower-impact energy sources, we also seek to strengthen energy management across operations. This includes scaling onsite generation, leveraging external sourcing mechanisms, and improving efficiency in energy-intensive processes.
Our approach combines operational improvements with system-level interventions, enabling a steady shift towards cleaner energy across regions. These efforts are supported by targeted investments and integrated into operations to drive long-term impact.
Purchased iREC quantities have not been included in the energy consumption figures presented in this section, as they do not represent energy consumed in operational form. iRECs are treated separately as renewable energy instruments used for market-based accounting purposes.
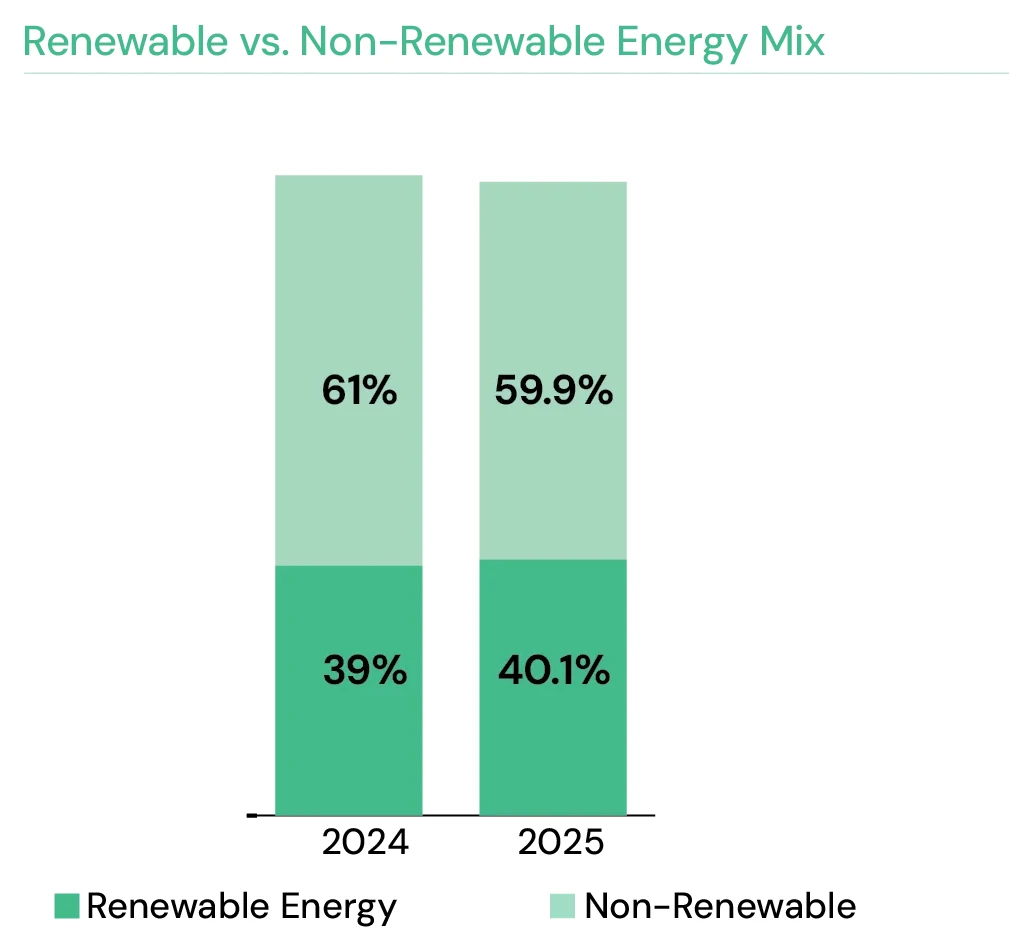
40.1%
of total energy mix from renewable sources (1.1% increase since 2024)
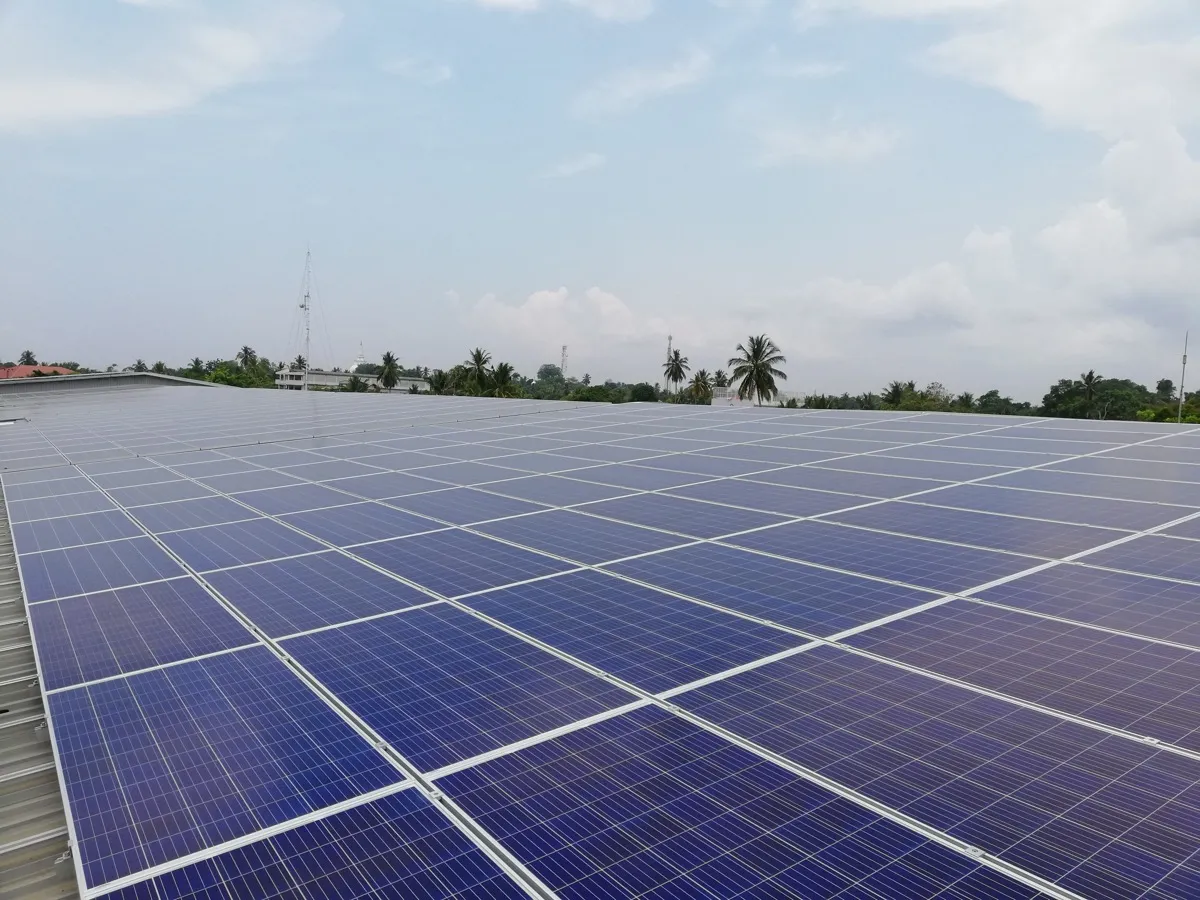
Project Photon
- 22.84 MW installed capacity
- 29 GWh renewable energy generated annually
- 13,456 MtCO₂e emissions avoided
Biomass Energy
Expanded use of certified biomass for steam generation
Optimising the Energy Mix
Optimising the energy mix remained a key driver of emissions reduction during the year, with continued efforts to shift towards renewable and lower-impact energy sources across operations. Renewable energy now accounts for 40.1% of the total energy mix, supported by initiatives such as scaling solar power through Project Photon and expanding the use of certified biomass for steam generation.
These efforts were supported through a combination of onsite energy generation and external sourcing mechanisms, contributing to a cleaner and more resilient energy mix across operations and regions.
Non-Renewable
60%
Renewable Energy
40%
Non-Renewable
61%
Renewable Energy
39%
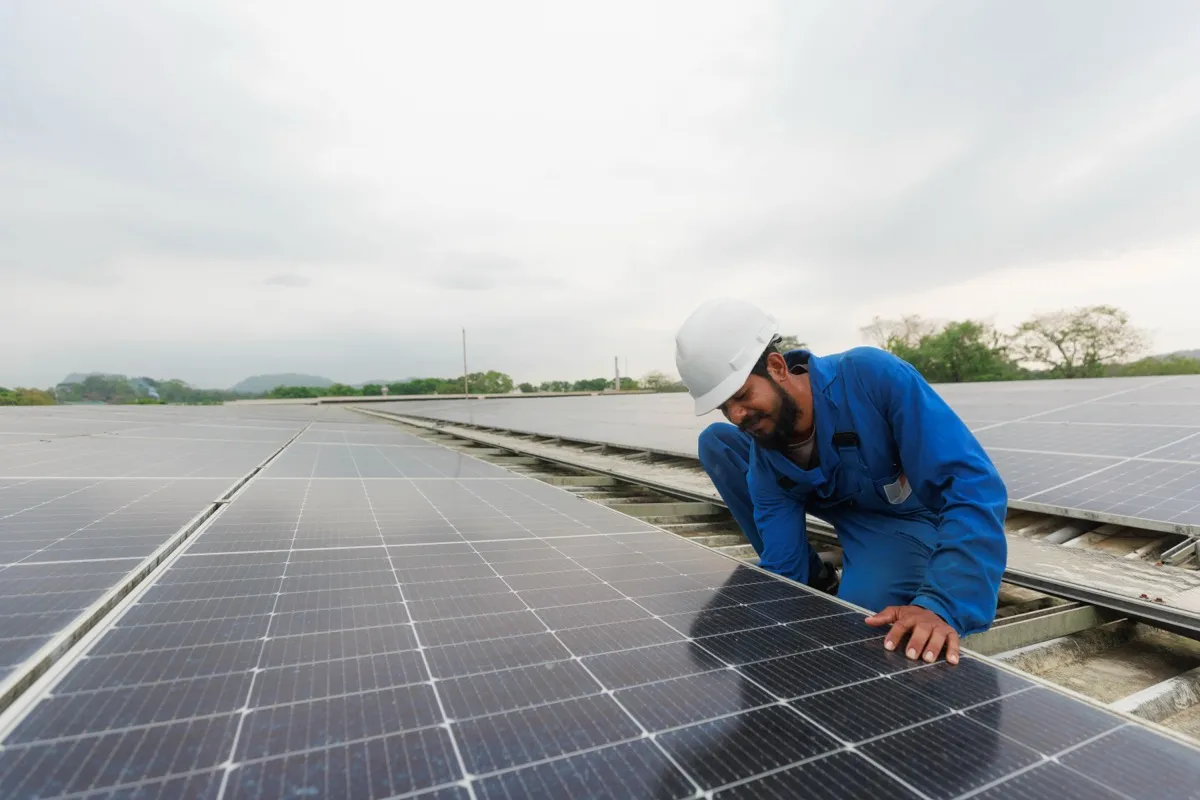
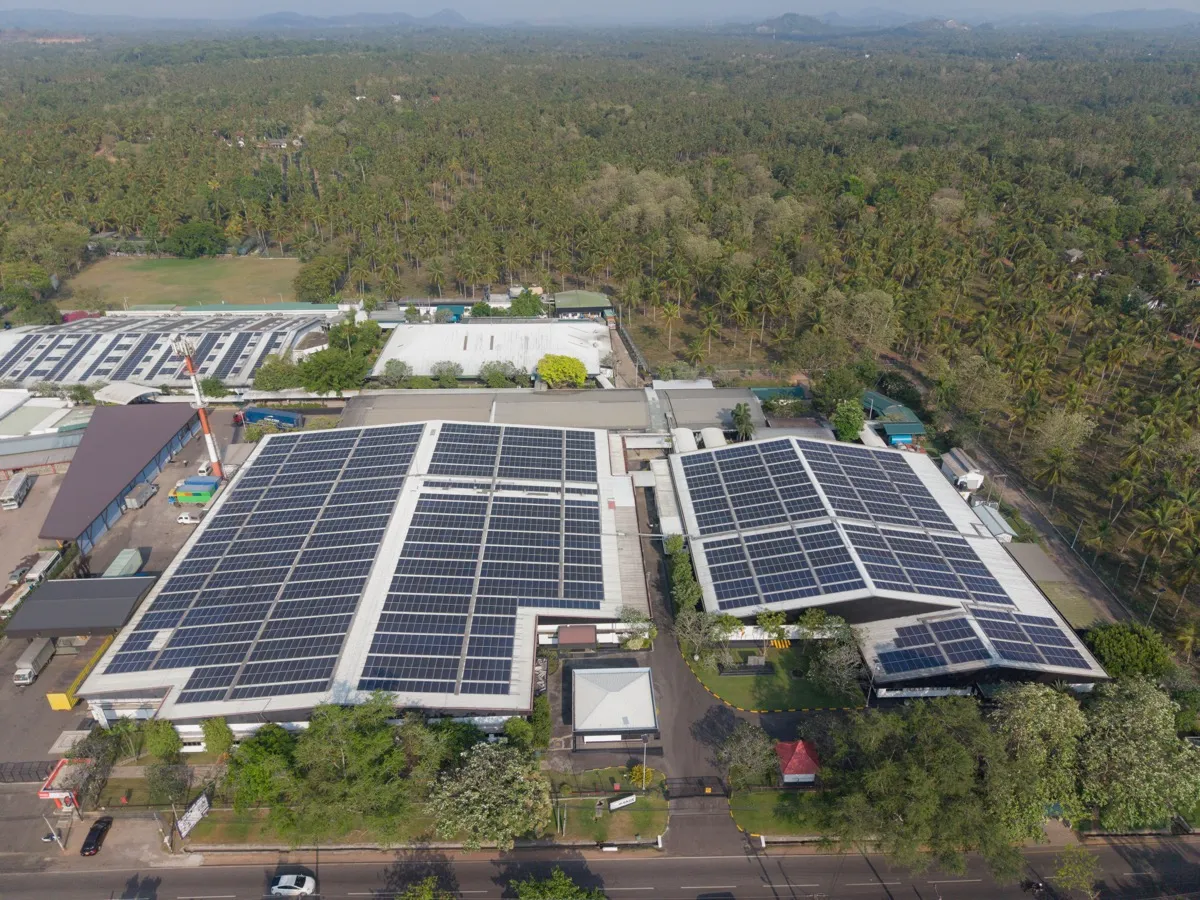
Renewable energy use at MAS includes onsite rooftop solar generation through Project Photon, which supports the Group's transition towards cleaner energy by expanding self-generated renewable electricity across selected facilities.
This is complemented by renewable energy sourcing mechanisms, including a power purchase agreement in India for the Intimates Fashion India and MAS Udyat Pvt Ltd facilities and 100% renewable energy across Indonesian operations, including PT MAS Arya Indonesia, PT MAS Arya 2 Indonesia and PT MAS Silueta Indonesia. Renewable Energy Certificates (iRECs) are also procured across facilities to support the transition towards cleaner energy and reduce Scope 2 emissions.
Primary Objective:
To promote sustainable and certified biomass sourcing by strengthening environmental integrity, biodiversity protection, regulatory compliance, and positive socio-economic outcomes across the value chain.
Methods of Action:
In 2025, MAS facilities including MAS Linea Intimo, Noyon Lanka, and MAS Fabric Park continued their efforts to utilise certified biomass under the SLS 1551 certification standard which is provided by Sri Lanka Standards Institution.
- MAS Linea Intimo and Noyon Lanka are focused on procuring biomass from suppliers already certified under SLS 1551.
- MAS Fabric Park is working towards certifying its own biomass supply chain by progressively engaging and certifying its supplier base.
MAS Linea Intimo
Achieved 9% utilisation of certified biomass under the SLS 1551 certification scheme
Noyon Lanka
Planned transition to certified biomass, with adoption expected from 2026
MAS Fabric Park
- Identified top 10 suppliers (from a base of 400), representing ~10% of biomass volume
- Initiated supplier engagement on SLS 1551 certification requirements
- Conducted site visits to validate biomass sources and supplier locations
- Mapped the supplier value chain
- Delivered training on sustainability, traceability, and certification standards
- Initiated implementation of required systems and processes
- Targeted completion of third-party audits in 2026, followed by SLS 1551 certification.
Energy Management
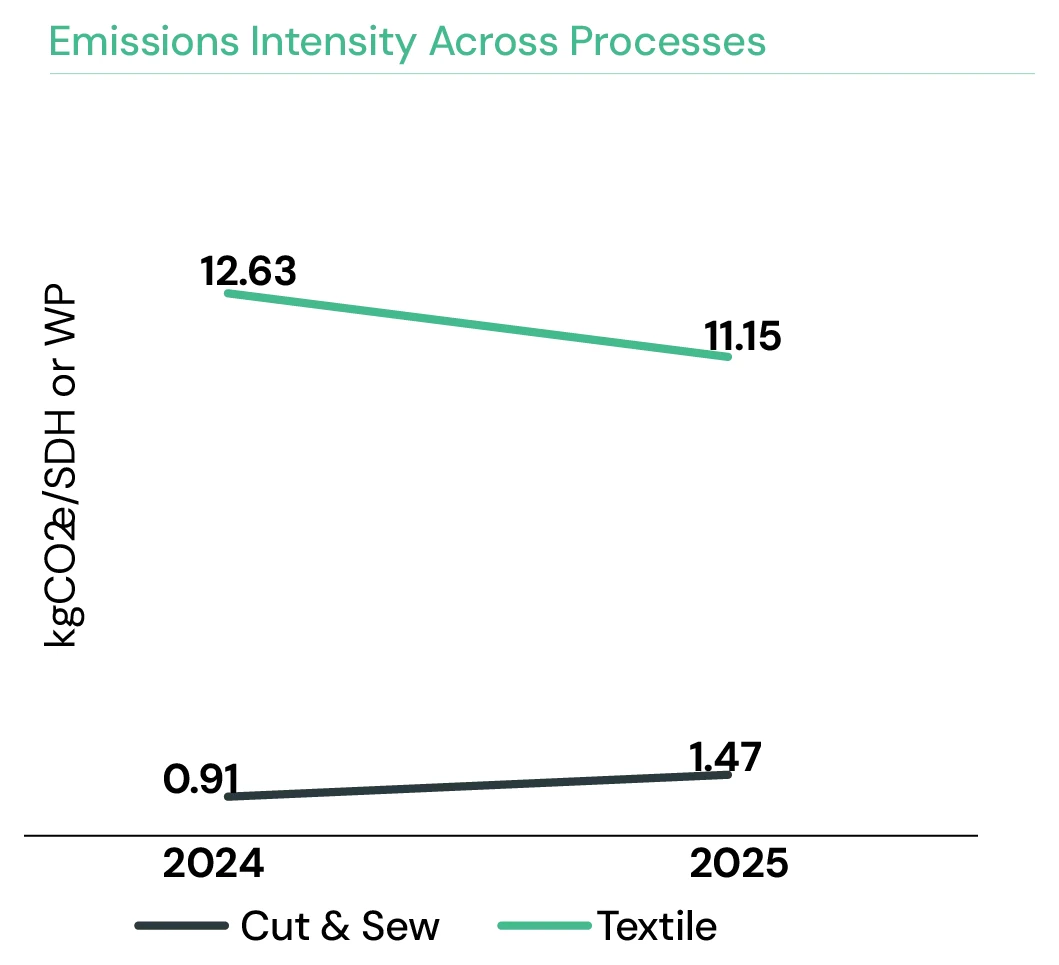
Energy management continued to support emissions reduction through better use of energy across operations. During the year, MAS focused on improving efficiency in energy-intensive processes, particularly in textile and apparel manufacturing.
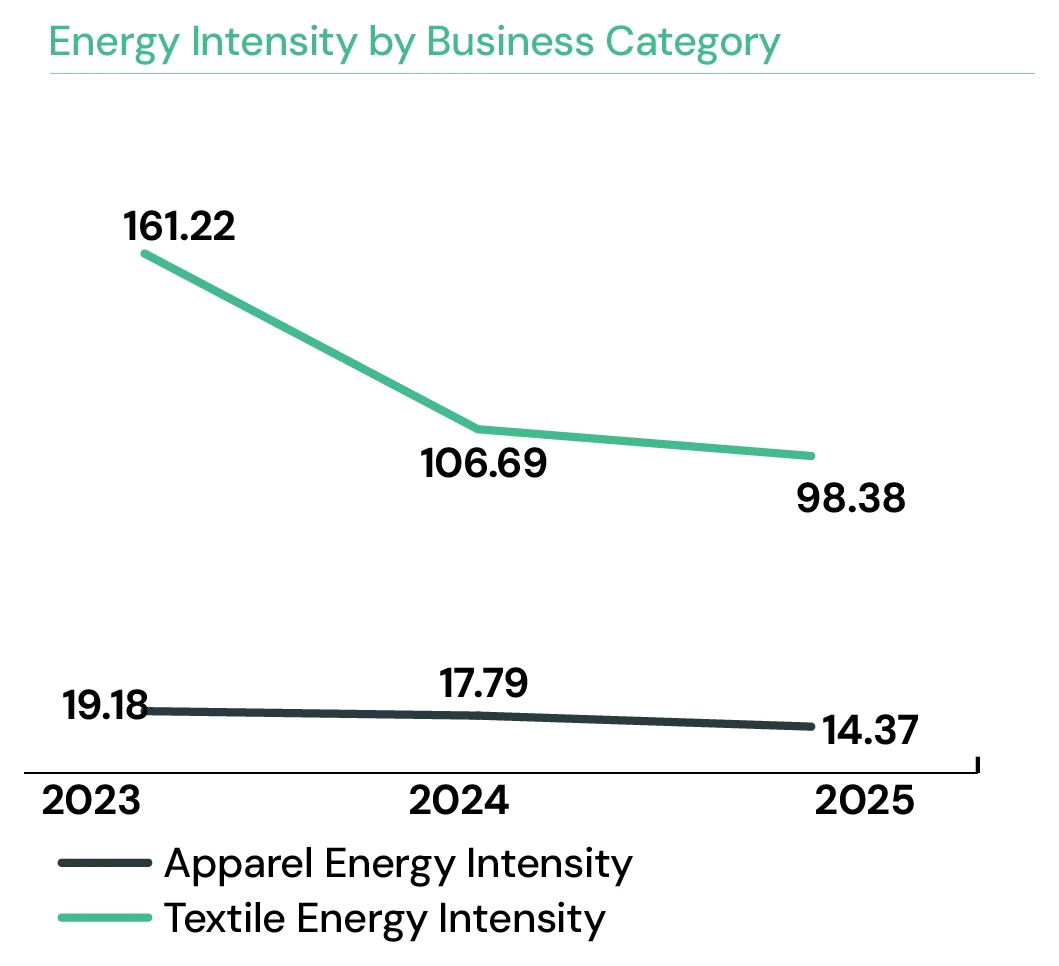
These improvements helped reduce energy use across production stages and contributed to continued improvements in both energy intensity and emissions intensity (see page 156–158).
- Replaced conventional black dyeing with an optimised grey dyeing process
- Introduced high-fixation dyes and streamlined process steps
- Optimised process sequencing and chemical dosing without changes to existing machinery
- Reduced water use and energy consumption per kg of fabric
- Shortened processing times, resulting in improved machine efficiency
- Lower wastewater generation due to better dye absorption
~28%
reduction in power consumption (↓ ~0.047 kWh/kg)
~19%
reduction in water consumption (↓ ~18.9 L/kg)
~29%
reduction in thermal energy use (↓ ~0.55 kWh/kg)
~23%
reduction in processing time (↓ ~2.45 hours per batch)
- Upgraded compressed air systems in cutting operations
- Replaced manual heat seal machines with energy-efficient technology
- Optimised compressor room performance and heat management
- Strengthened leak detection and system efficiency
- Introduced localised pressure control and improved airflow management within compressed air systems
- Reduced electricity consumption across operations
- Lower system losses and improved equipment efficiency
- Reduced operating costs and emissions
656,339 kWh
saved annually
USD 41,149.56
saved annually
3.6%
in water consumption
- Converted conventional moulding machines to induction heating technology
- Optimised HVAC systems through capacity reduction and airflow improvements
- Upgraded compressed air systems and reduced leakages
- Introduced automated controls for lighting and ventilation
- Supported by heat load assessments, duct redesign, and system-level efficiency improvements
- Reduced electricity consumption across production and facility operations
- Improved efficiency of heating, cooling, and compressed air systems
- Eliminated energy use during idle and non-operational periods
USD 62,326
annual savings
38
machines converted
~25%
energy savings per machine
90 tons
excess cooling capacity removed
- Installed motorised valves to isolate compressed air during non-production hours
- Enabled controlled system shutdown without manual intervention
- Reduced unnecessary compressor operation
- Lower energy use during idle periods
25%–29%
in compressor energy consumption
- Identified and repaired compressed air leaks
- Optimised distribution systems and reduced pressure losses
- Improved compressor room ventilation and operating conditions
- Strengthened monitoring and preventive maintenance
- Included pipeline resizing and receiver capacity improvements
- Reduced system-wide energy losses
- Improved stability and efficiency of compressed air systems
- Enhanced equipment performance
122,425 kWh
saved annually
USD 216,368.3
machines converted
Targeting10%
in compressed air leakage
A centralised platform to capture, track, and share sustainability initiatives across facilities, enabling visibility and replication of successful projects across business units.
Structured development of sustainability teams to strengthen technical, management, and leadership capabilities, improving execution of environmental initiatives across operations.
Energy Consumption at a Glance
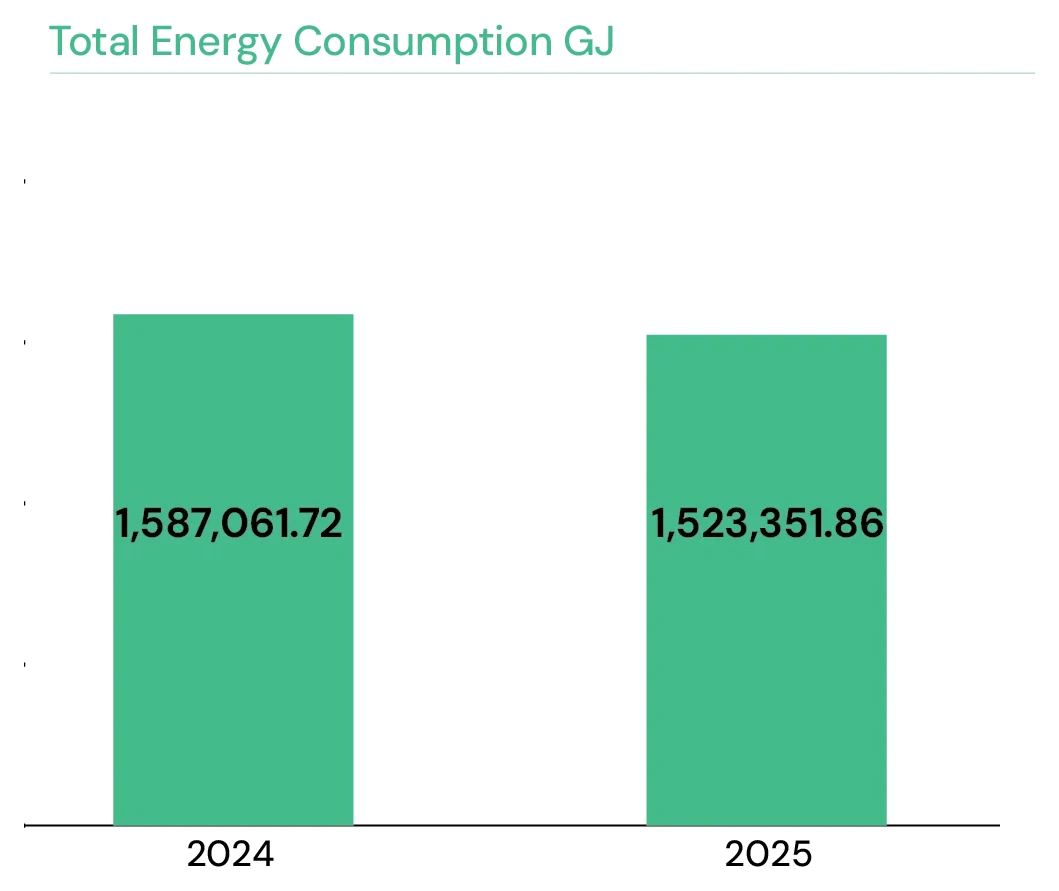
In 2025, total energy consumption amounted to 1,523,351.86 GJ, reflecting a 4.01% reduction from 1,587,061.72 GJ in 2024. Energy consumption from non-renewable sources reduced by 6.09%, from 972,507.41 GJ in 2024 to 913,234.28 GJ in 2025.
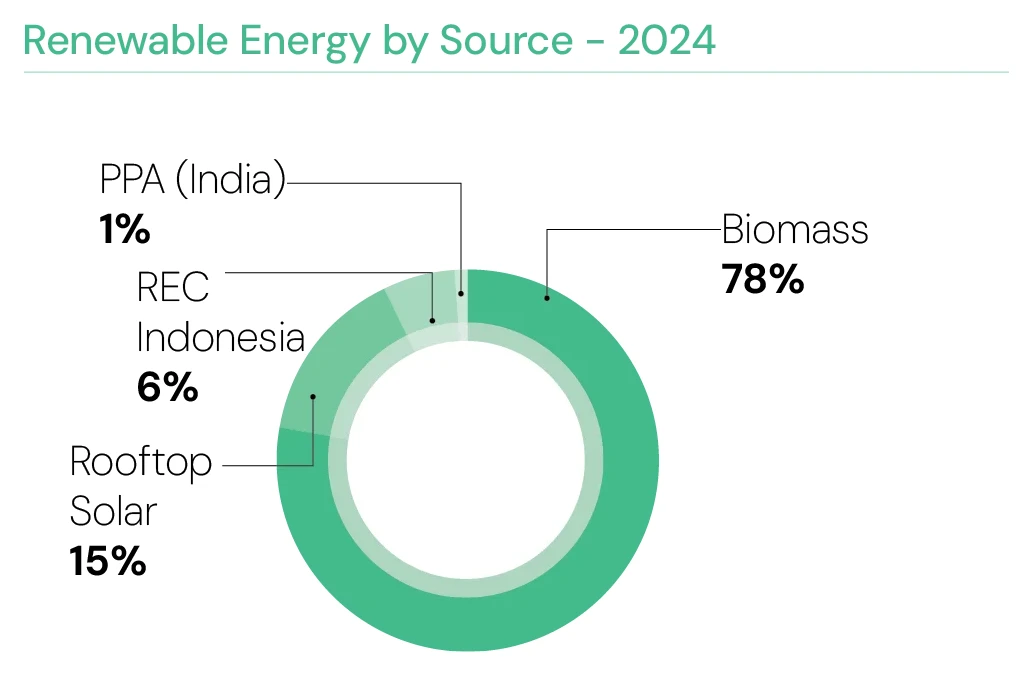
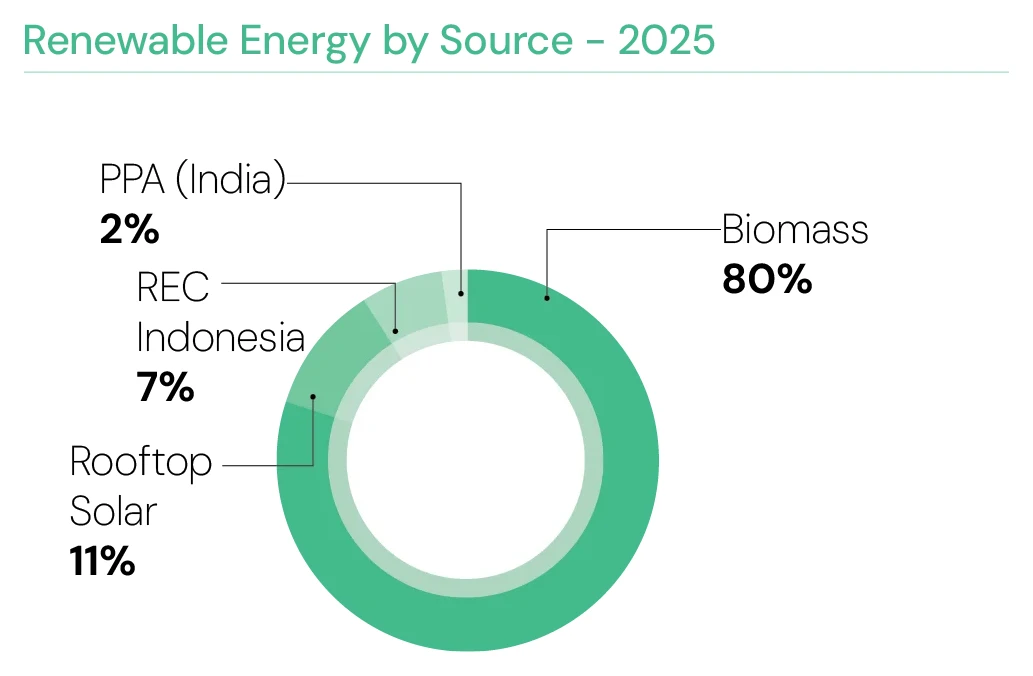
Energy consumption from renewable sources stood at 610,117.59 GJ, compared to 614,554.31 GJ in the previous year. As a result, renewables accounted for 40.1% of the Group's energy mix in 2025, up from approximately 39% in 2024.
Year-on-year improvements in energy use and efficiency are supported by strengthened facility-level measurement systems and standardised monitoring approaches, enabling more consistent tracking of energy performance across operations.
Energy consumption is monitored through the implementation of an Energy Monitoring System (EMS) across MAS operations. This system is supported by structured data collection, analysis, and reporting mechanisms, enabling continuous monitoring of energy consumption patterns. The approach facilitates the identification of inefficiencies, supports data-driven decision-making, and drives energy optimisation initiatives across facilities.
1.52 Mn GJ
Total energy consumption in 2025
4.0%
Year-on-year reduction in total energy consumption
80.0%
Biomass share within renewable energy
11.3%
Rooftop solar share within renewable energy
53,061 GJ
Combined contribution from RECs and PPAs
26,235 GJ
Electricity sold during the year

- The Group's energy profile improved during the year, with renewable energy gaining a larger share as overall energy consumption and non-renewable energy use reduced.
- Biomass continued to anchor the renewable energy mix, reflecting its continued importance in supporting thermal energy requirements across operations.
- Rooftop solar remained the largest direct renewable electricity source, strengthening the Group's renewable energy base beyond biomass.
- RECs and PPAs supported the Group's market-based renewable energy sourcing approach, complementing direct renewable energy generation and consumption.
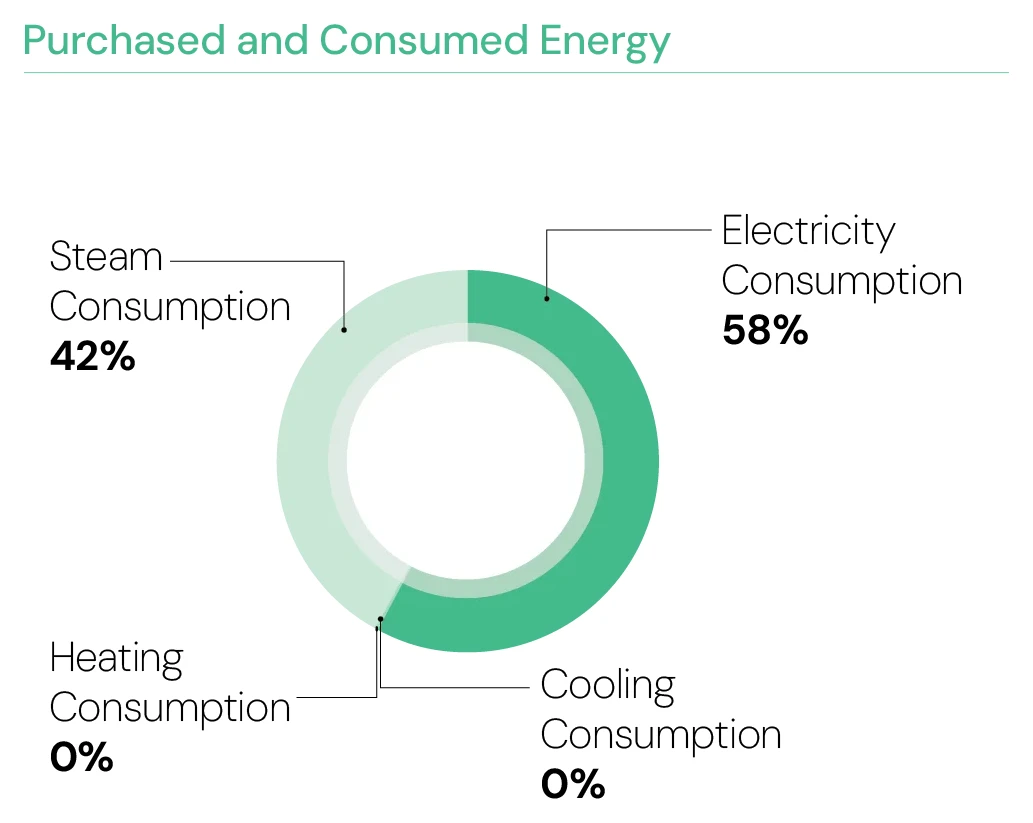
- Electricity and steam continued to account for over 99% of all purchased and consumed energy, underscoring the importance of electricity transition and thermal energy efficiency in the Group's decarbonisation pathway.
- The sale of electricity reflects the Group's ability to generate energy beyond direct operational consumption in selected locations.